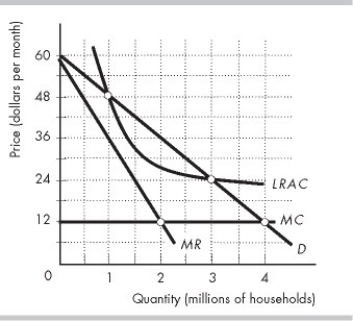
-The figure above shows the demand curve (D) faced by Visual, Inc., a cable TV company, and the firm's marginal revenue (MR) , marginal cost (MC) , and average cost (LRAC) curves. If Visual is regulated according to an average cost pricing rule, it will serve ________ million households and set a price of ________ per household per month.
Definitions:
Technical Substitution
The process of replacing one set of input variables or resources with another set, in production processes, to achieve a similar level of output. This reflects the firm’s ability to adapt to changes in resource availability or cost.
Isoquant
A curve on a graph representing combinations of inputs that yield the same level of output.
MRTS
The Marginal Rate of Technical Substitution, the rate at which one input can be replaced by another while keeping output constant.
Isoquant Map
An isoquant map is a graphical representation used in economics to show combinations of inputs, like labor and capital, that produce the same level of output, illustrating how inputs can be substituted for one another.
Q14: Monopolies can make an economic profit in
Q22: In the figure above, Gap maximizes its
Q41: One benefit of monopolistic competition over perfect
Q88: Which of the following statements applies to
Q177: Why are selling costs high in monopolistic
Q240: The table above gives the demand for
Q244: If marginal revenue is greater than zero,
Q326: The monopoly illustrated in the figure above
Q454: Comment on the following: "A monopolist is
Q457: In the case of a perfectly price-discriminating