Income (percent of total)
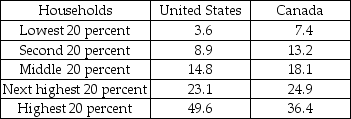
-The table shows income distributions in the United States and Canada in a recent year.
a) Draw a Lorenz curve for the United States. According to your graph, what is the percentage of income received by the poorest 30 percent of households? The richest 10 percent?
b) On the same graph, draw a Lorenz curve for Canada. According to your graph, what is the percentage of income received by the poorest 30 percent of households? The richest 10 percent?
c) Draw the line of equality. How is it related to the Lorenz curve?
d) Is income distributed more equally in the United States or in Canada? Which country's Gini ratio is closer to zero? Explain your answers.
Definitions:
Q21: Which of the following groups is the
Q44: Discounting is the process whereby<br>A) present values
Q61: Level curves are used when solving LP
Q69: All of the following are true about
Q97: Moral hazard results from _ information and
Q119: In the figure above, in which country
Q119: Bobby is offered a job as a
Q159: The above figure shows two Lorenz curves.
Q268: St. Mary's Church has a balloon payment
Q342: According to the Hotelling Principle, the price