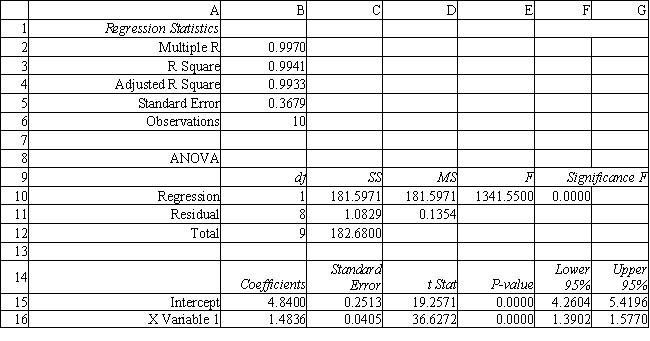
Exhibit 9.1
The following questions are based on the problem description and spreadsheet below.
A company has built a regression model to predict the number of labor hours (Yi) required to process a batch of parts (Xi). It has developed the following Excel spreadsheet of the results. 
-Refer to Exhibit 9.1. Provide a rough 95% confidence interval on the number of labor hours for a batch of 5 parts.
Definitions:
Desired Goals
Objectives or outcomes that an individual or group aims to achieve, based on personal values, aspirations, or professional targets.
Treatment Process
The structured method or course of actions designed to address and manage a health condition, including diagnosis, intervention, and monitoring.
Maintenance Strategy
A plan for managing and conducting regular upkeep to ensure the optimal functioning and prolong the lifespan of assets or systems.
Monitoring Phase
A stage in various processes (e.g., treatment, project management) where progress is closely observed and assessed to ensure objectives are being met.
Q1: Refer to Exhibit 10.2. What is the
Q16: Refer to Exhibit 9.3. Interpret the meaning
Q20: Refer to Exhibit 8.2. What formula would
Q28: Which of the following represents a
Q35: Which of the following is the typical
Q42: In the GRG algorithm the initial solution
Q48: A company wants to use PERT
Q57: How much must the objective function coefficient
Q69: Refer to Exhibit 11.23. What is the
Q70: How is mean absolute deviation calculated?<br>A)<img src="https://d2lvgg3v3hfg70.cloudfront.net/TB5443/.jpg"