Use the graphs below to answer the following questions.
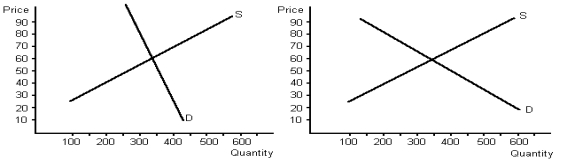 a. Determine equilibrium price and quantity for each graph.
b. Given demand and supply, what would total revenue be for each graph?
c. Assume that supply shifts to the left on both graphs by 100, raising price. Given the new equilibrium price and equilibrium quantity, what would total revenue be for each graph?
d. What do your answers to part c tell you about the relationship between elasticity of demand and total revenue?
Definitions:
Treasury Stock
A corporation’s own stock that has been issued and subsequently reacquired from shareholders by the corporation but not retired.
Investing Activity
Transactions involving the purchase or sale of long-term assets and investments, reflected in the cash flow statement of a company.
Operating Activities
Activities that relate to the primary operations of a company, such as selling goods and services, which generate revenue and expenses.
Fixed Assets
Long-term tangible assets used in the operations of a business, not expected to be converted to cash within a year.
Q14: The particular price that results in quantity
Q28: In the 1970s OPEC generated high prices
Q44: According to Table 3-1:<br>A) the potato farmer
Q82: Refer to Table 3-4. If England and
Q84: Often the tax revenue collected by the
Q92: Jean wants to sell her camera. Greg
Q94: According to the Laffer curve, what will
Q102: The main determinant of the price elasticity
Q117: According to the famous economist Milton Friedman,
Q180: Graphically, the market demand curve is:<br>A) the