Multiple Choice
Graph 7-1
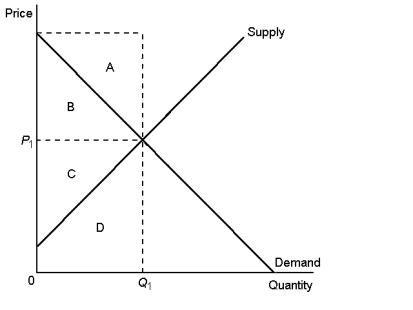
-Refer to Graph 7-1. What area represents total surplus in the market when the price is P1?
Definitions:
Related Questions
Q48: What is the effect on the economic
Q53: Suppose a country becomes more open to
Q57: In Graph 9-3, after the quota, deadweight
Q82: Given the following demand schedule, graph Lee's
Q86: Last year, Amy bought two lenses for
Q106: Using demand-supply diagrams, show the difference in
Q123: If price changes and total revenue changes
Q125: A negative externality exists when:<br>A) a person
Q156: Based on Table 7-7, if Fred and
Q219: Refer to Table 4-2. In the table