Graph 9-2
This graph refers to the market for saddles in Argentina.
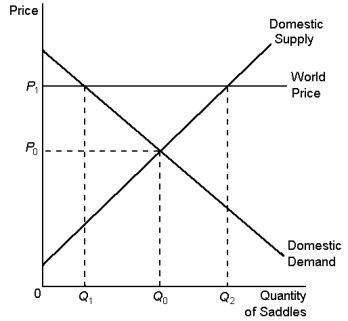
-According Graph 9-2, the quantity of saddles exported from Argentina is:
Definitions:
Transportation Model
A mathematical model used to plan and optimize the transportation of goods between various locations while minimizing costs.
Degenerate
Refers to a decline in physical, moral, or cultural qualities, often implying a deterioration from a former state.
Sources
Origins or points of procurement for materials, information, or inputs required for the production or operation process.
Destinations
The end points or locations to which goods, services, or information are sent or directed.
Q2: The Laffer curve indicates that income tax
Q24: Some goods can switch between being public
Q25: If children impose a negative externality, which
Q36: In the Tragedy of the Commons, joint
Q37: According to Graph 6-2, a binding price
Q58: According to Graph 8-2, when the market
Q60: Supply-side economics can be a winning strategy
Q66: A price floor is not binding if:<br>A)
Q67: Internalising a positive production externality will cause
Q77: Producer surplus equals:<br>A) value to buyers -