Graph 9-2
This graph refers to the market for saddles in Argentina.
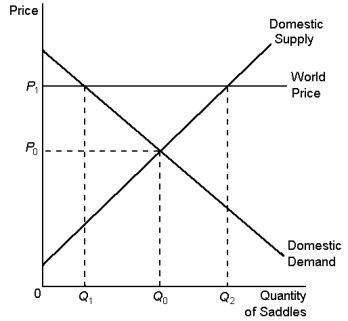
-According to Graph 9-2, the price and quantity demanded of saddles in Argentina after trade would be:
Definitions:
Quantitative
Pertaining to the measurement and quantification of variables to analyze statistical, mathematical, or computational techniques.
Systematic
Systematic refers to a methodical approach to procedures or processes that follow a fixed plan or system, ensuring consistency and efficiency.
Data Reduction
The process of transforming and simplifying large sets of raw data into a more manageable form, enabling easier analysis and interpretation without losing significant information.
Content Analysis
A research method used to systematically analyze text or media to identify patterns, themes, or biases.
Q28: Suppose there is a price decrease. Assuming
Q77: One of the most pressing concerns associated
Q104: Ticket scalping leads to a reduction in
Q107: Which of the following is true of
Q108: In many cities, vacant lots are required
Q138: 'Loopholes' refer to the detailed provisions of
Q139: What is meant by 'internalising' an externality?
Q160: Using Graph 9-15, assume that the government
Q161: The producer surplus in a market is
Q185: A positive consumption externality occurs when:<br>A) Jack