Multiple Choice
Graph 10-2
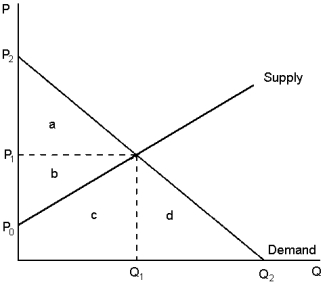 This graph depicts the market for pork. Use this information to answer the following question(s) .
-In Graph 10-2, consumer surplus would be maximised at what price and quantity combination?
Definitions:
Related Questions
Q7: The 'invisible hand':<br>A) is the name of
Q26: Cost-benefit analysis can account for risk by
Q33: Using Graph 9-11, fill-in the answers for
Q58: If one person's use of a good
Q59: Because taxes distort incentives, they cause markets
Q65: Producer surplus measures the:<br>A) wellbeing of sellers<br>B)
Q72: The marginal seller is the seller who:<br>A)
Q96: Which of the following is a tax
Q102: The Coase theorem suggests that efficient solutions
Q132: According to this statement, if trade in