Graph 10-3 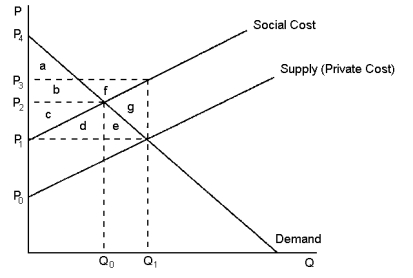 This graph reflects the market for kiwifruit, where pesticide used by kiwifruit orchardists also unintentionally kills honey bees.
-Refer to Graph 10-3.The social cost curve is above the supply curve because:
Definitions:
Informative
Providing useful or important information or details.
Assumptions
Statements or ideas accepted as true without proof, used as the basis for reasoning or argumentation.
Explanandum
The phenomenon or event that is to be explained, often used in the context of scientific inquiry.
Hypothesis
A proposed explanation for a phenomenon, often based on limited evidence as a starting point for further investigation.
Q20: When taxes are justified on the basis
Q29: The Laffer curve is the curve showing
Q66: Of all the possible types of taxes,
Q72: In Singapore, property taxes on an automobile
Q84: To gauge the extent to which the
Q106: The Internet is a good example of
Q125: A negative externality exists when:<br>A) a person
Q130: According to Graph 9-1, if trade in
Q180: Market failure with common resources occurs because:<br>A)
Q194: The impact of one person's actions on