Multiple Choice
Graph 13-6
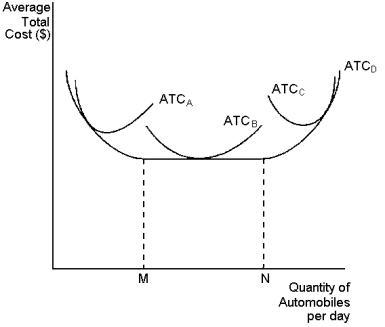 This graph depicts average total cost functions for a firm that produces automobiles. Use the graph to answer the following question(s) .
-Refer to Graph 13-6. This firm experiences economies of scale at which output levels?
Definitions:
Related Questions
Q11: When a firm operates under conditions of
Q21: National defence is a classic example of
Q24: Some goods can switch between being public
Q37: When new firms enter a perfectly competitive
Q103: According to the information provided, which of
Q109: If Jack and Joe are the only
Q109: Average variable cost is equal to the
Q122: The time it takes for a firm
Q127: The 'flypaper theory' of taxation means that
Q138: To an economist, the field of industrial