Graph 13-6
 This graph depicts average total cost functions for a firm that produces automobiles. Use the graph to answer the following question(s) .
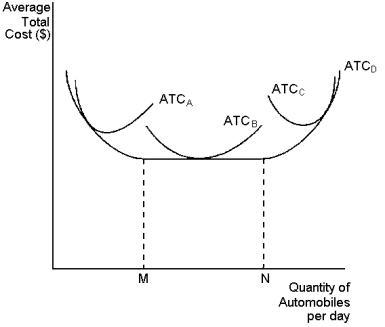
-Refer to Graph 13-6. At levels of output above point N, the firm experiences:
Definitions:
Leadership Stereotype
Preconceived notions or generalizations about the qualities or behaviors typical of leaders.
Male Dominance Behaviors
Actions or communication styles that assert the superiority or control of men over others, often observed in social and organizational contexts.
Labyrinth
A complex and intricate network of paths or passages, often used metaphorically to describe a complicated situation or problem to be solved.
Incongruity
A state of being out of harmony or lacking agreement between elements.
Q12: The shape of the total cost curve
Q13: The marginal tax rate is the appropriate
Q15: Consider the following graph of a firm
Q29: If a profit-maximising firm in a competitive
Q34: If a firm is operating at an
Q35: Refer to Table 13-2. Adrienne has received
Q79: Lump-sum taxes:<br>A) are most frequently used to
Q120: A poor way to value human life
Q180: Market failure with common resources occurs because:<br>A)
Q199: During the life of a drug patent,