Graph 14-7
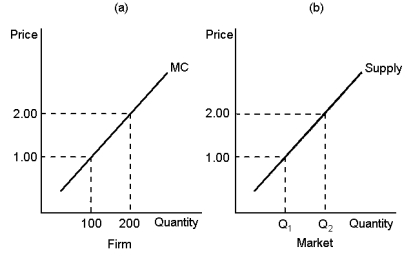 In this graph, panel (a) depicts the linear marginal cost of a firm in a competitive market, and panel (b) depicts the linear market supply curve for a market with a fixed number of identical firms. Use the graph to answer the following question(s) .
-Refer to Graph 14-7. If there are 30 identical firms in this market, what level of output will be supplied to the market when price is $1.00?
Definitions:
Q1: Suppose that Amy and George have the
Q2: Refer to Table 13-2. What is the
Q16: A profit-maximising firm should always increase the
Q50: According to the information provided, if a
Q63: Explain why the long-run average total cost
Q69: At the end of the process of
Q81: When the price of a good increases,
Q93: Refer to Graph 13-5. Which of the
Q122: The time it takes for a firm
Q150: When an oligopoly market is in Nash