Graph 15-3
 This graph reflects the cost and revenue structure for a monopoly firm. Use the graph to answer the following question(s) .
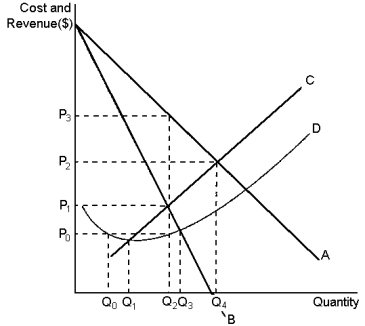
-Refer to Graph 15-3. A profit-maximising monopoly would have a total cost equal to:
Definitions:
Average Fixed Costs
The total fixed expenses of a business divided by the quantity of units produced, decreasing as production increases.
Variable Costs
Variable Costs are expenses that change in direct proportion to the volume of output or activity in a business, such as materials and labor.
Average Fixed Costs
The fixed costs of production (costs that do not change with the level of output) divided by the quantity produced.
Q29: Monopoly pricing prevents some mutually beneficial trades
Q39: Prawns Galore, a prawn harvesting business in
Q80: The entry of new firms into a
Q85: Refer to Graph 13-6. If the firm
Q103: According to the information provided, which of
Q152: Refer to the information provided. In 1971,
Q163: Refer to Table 16-2. What is the
Q164: Why is a lack of cooperation between
Q175: Refer to Graph 13-6. Which of the
Q177: The practice of selling the same goods