Graph 17-3 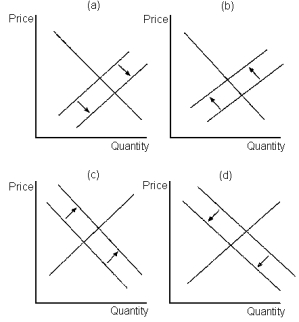 Lines in these figures reflect the potential effect of entry and exit in a monopolistically competitive market on the demand and/or marginal cost curves of incumbent firms.
-Refer to Graph 17-3.Panel d in the set of figures shown depicts the effect on incumbent firms of:
Definitions:
Legal Issues
Disputes or controversies that are submitted to a court for resolution involving questions of law or legal principles.
European Community
An economic and political union established by six European countries in 1957, which expanded and evolved into what is now the European Union (EU), aimed at fostering economic cooperation and integration among its members.
Predecessor
An entity or person who held a position or role before the current holder.
Sherman Act
A landmark federal statute in the antitrust law of the United States, passed in 1890, that outlaws monopolistic business practices.
Q10: What is the rationale for transparent pricing
Q27: Refer to Table 16-3. Suppose the town
Q36: Some shops may provide a lot of
Q37: The theory of efficiency wages explains above-equilibrium
Q89: The fact that workers receive different wages
Q133: Refer to Table 15-1. If the monopolist
Q153: Refer to Table 16-6. The Nash equilibrium
Q159: OPEC can be classified as which of
Q165: When an industry is a natural monopoly:<br>A)
Q201: For a monopolist, when does marginal revenue