Related Questions
Q14: Refer to Table 7-5.Which of the following
Q65: Refer to Figure 8-4.The amount of deadweight
Q120: Relative to a situation in which gasoline
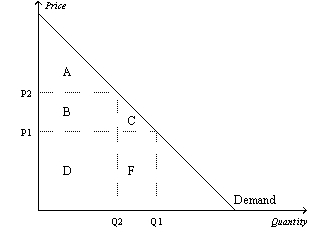
Q185: Refer to Figure 7-8.If the supply curve
Q238: Refer to Figure 8-6.When the government imposes
Q243: Total surplus in a market will increase
Q291: When a tax is levied on a
Q318: If a market is allowed to move
Q322: The tax incidence depends on whether the
Q329: Refer to Figure 8-8.The tax causes producer
