Figure 10-9 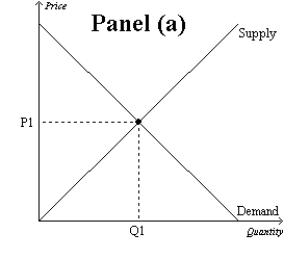
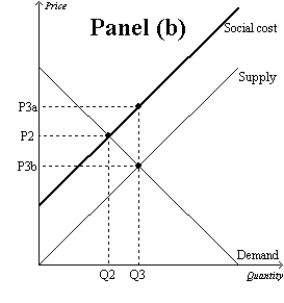
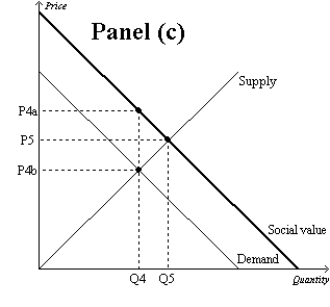
-Refer to Figure 10-9. Which graph represents a market with no externality?
Definitions:
Consolidated
Combines the financial statements of the parent company and its subsidiaries into one comprehensive financial statement, presenting the financial performance and position as a single entity.
Interest Rate
The percentage at which interest is paid by a borrower for the use of money that they borrow from a lender.
Issued Capital
The total value of a company's shares that have been sold to shareholders and are currently outstanding.
Market Value
The current price at which an asset or service can be bought or sold in the market.
Q18: Which of the following is NOT a
Q81: Reggie,Rachael,and Rudy all enjoy looking at flowers
Q96: The national defense of the United States
Q211: The nation of Waterland forbids international trade.In
Q229: Refer to Figure 9-14.When the country for
Q295: The administrative burden of any tax system
Q311: Refer to Figure 9-17.Without trade,consumer surplus is<br>A)
Q332: According to the Coase theorem,if private parties
Q338: Which of the following is the most
Q378: Today the typical American pays approximately what