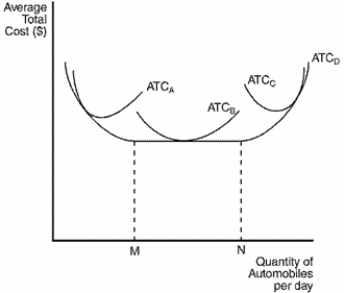
Figure 13-9
The figure below depicts average total cost functions for a firm that produces automobiles. 
-Refer to Figure 13-9. In the long run, the firm can operate on which of the following average total cost curves?
Definitions:
Markov Model
A Markov Model is a mathematical system that undergoes transitions from one state to another on a state space. It is used for predicting the likelihood of future events based on current or past events.
Bullwhip Effect
When errors in estimating the supply of human capital are amplified along the supply chain, resulting in large overestimates of hiring needs.
Human Capital
The collective skills, knowledge, or other intangible assets of individuals that can be used to create economic value.
Linear Programming
A complex mathematical procedure commonly used for project analysis in engineering and business applications; it can determine an optimum or best-supply mix solution to minimize costs or other constraints.
Q23: A firm operating in a perfectly competitive
Q88: Susan used to work as a telemarketer,earning
Q154: Profit-maximizing firms in a competitive market produce
Q207: Refer to Table 14-6.What is the marginal
Q226: A firm will shut down in the
Q239: In the long run,each firm in a
Q266: The long-run supply curve for a competitive
Q322: On a 100-acre farm,a farmer is able
Q342: Refer to Table 13-7.What is the marginal
Q385: Refer to Table 13-7.What is the variable