Multiple Choice
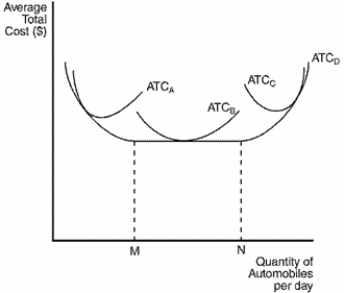
Figure 13-9
The figure below depicts average total cost functions for a firm that produces automobiles. 
-Refer to Figure 13-9. This firm experiences diseconomies of scale at what output levels?
Definitions:
Related Questions
Q10: In making a short-run profit-maximizing production decision,the
Q63: You are trying to design a tax
Q89: Refer to Scenario 14-2.At Q = 999,the
Q98: Refer to Figure 13-2.As the number of
Q169: The long-run supply curve in a competitive
Q177: If marginal cost is rising,<br>A) average variable
Q223: Refer to Table 12-12.Samantha is a single
Q357: List and describe the characteristics of a
Q364: As a firm moves along its long-run
Q378: Refer to Table 13-12.Which firm is experiencing