Multiple Choice
The following diagram shows one indifference curve representing the preferences for goods X and Y for one consumer. 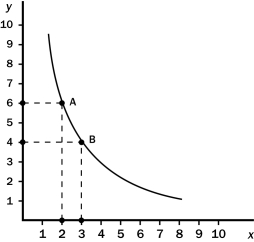
What is the marginal rate of substitution between points A and B?
Definitions:
Related Questions
Q38: Economists who study economic mobility have found
Q53: Refer to Table 22-6.The table shows the
Q55: U.S.GDP was almost $14 billion in 2007.
Q61: U.S.GDP includes the market value of rental
Q108: Explain the relationship between the budget constraint
Q148: Proponents of welfare reform claim that programs
Q194: Which of the Ten Principles of Economics
Q223: Assume you are a critic of welfare
Q226: In economics,a difference in access to relevant
Q233: What percent of families are poor for