Multiple Choice
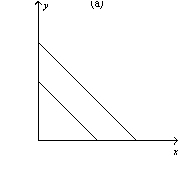
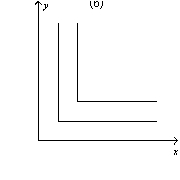
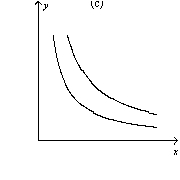
Figure 21-8 


-Refer to Figure 21-8.Which of the graphs shown may represent indifference curves?
Definitions:
Related Questions
Q37: While GDP includes tangible goods such as
Q40: Which of the following is correct?<br>A) Incomes
Q49: When each voter has a most-preferred outcome
Q153: The ultimatum game reveals that<br>A) it does
Q175: The United States has less income inequality
Q195: In years of economic contraction,firms throughout the
Q213: A radio story reported a study on
Q215: Government vouchers to purchase food,also known as
Q215: Majority rule will produce the outcome most
Q277: A U.S.family earning $80,000 would be in