Aggregate Supply Curves (2) 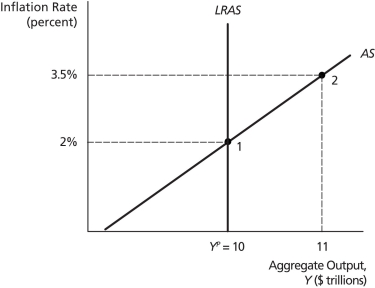
-On the graph above,
(a)draw the new short-run aggregate supply curve that results when the economy has been at point 2 for one period,ceteris paribus (do not label the new output level or inflation rate)
(b)on the original AS curve,add a point "3" where output is 10.5.On the vertical axis,label the rate of inflation that corresponds to output of 10.5.
(c)draw the new short-run aggregate supply curve that results when the economy has been at point 3 for one period,ceteris paribus (do not label the new output level or inflation rate)
Definitions:
Correctly Formatted
Refers to data, text, or a document that is arranged according to specific guidelines or standards for readability or processing.
Works Cited
A list of sources that have been referred to and cited in a document, typically found at the end of academic papers.
MLA Guidelines
A set of rules and standards for writing and citation developed by the Modern Language Association, mainly used in humanities.
Parentheses
Punctuation marks used in pairs to include material that clarifies or is supplementary to the main text, without interrupting its flow.
Q1: Fixed investment is typically _.<br>A)smaller than inventory
Q13: When a permanent negative supply shock hits
Q23: As of 2013,the debt of the U.S.government
Q41: If for any given inflation rate,the federal
Q52: Planned investment spending _.<br>A)is equal to planned
Q56: The years from 1945 to 1973 are
Q61: Which of the following is a distinctive
Q70: An increase in asymmetric information that increases
Q78: The Conference Board does a good job
Q89: The IS curve _.<br>A)shows the relationship between