Following is a table of data collected from one section of an 8 a.m.physiology lab.There were 20 students present, 10 men and 10 women.Information collected from the students included their height, weight, age, gender, and resting pulse rate.In addition, the students were surveyed to see if they smoked cigarettes, considered themselves "regular exercisers," if they had consumed caffeine the morning of the lab, and if they had eaten breakfast that day.A "y" or "n" (yes or no) was recorded to indicate their answers.Each student did "jumping jacks" for 5 minutes and recorded the time required to regain their resting heart rate, which is listed on the table as "recovery time." Finally, each student participated in an exercise designed to measure their reaction time (in milliseconds) in catching an object dropped by a lab partner according to specified criteria.Use this table to answer the following questions.Ignore statistical problems caused by small sample size, and so on.
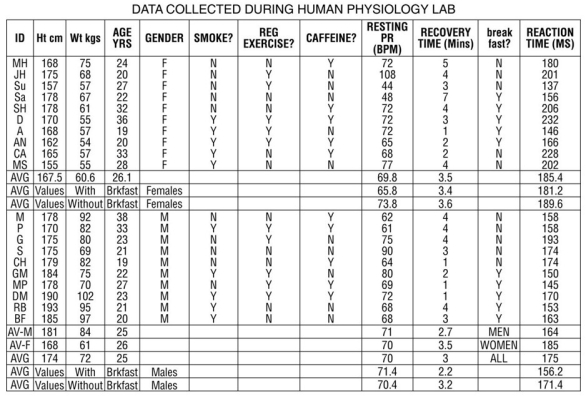
Table 1.3
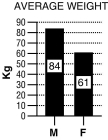
Figure 1.3
For these questions, the data were separated and analyzed by gender.
-Table 1.3 shows data on various factors that may or may not be related to resting pulse rate, time to recovery to resting pulse rate after a few minutes of exercise, and reaction time measured by how quickly a student could press a keyboard key after seeing a computer-generated prompt.For each question below, write a testable hypothesis, identify the dependent and independent variables, sketch an appropriate graph of the results, and draw a conclusion from the data presented in the table.Discuss your results.
A.Does caffeine consumption have an effect on resting pulse rate?
B.Does age play a role in resting pulse rate? Does weight?
C.Is there a relationship between eating breakfast and recovery time?
D.Is there a relationship between reaction time and height?
E.Do women who smoke show differences in their resting pulse rates compared to female nonsmokers or to male smokers and nonsmokers?
F.Does regular exercise have an effect on resting pulse rate?
Definitions:
Locational Fit
The tolerance and fit specification designed to maintain precise location of a part or component, ensuring proper alignment and function without regard to clearance or interference conditions.
Drive Or Force Fit
Drive or force fit refers to a type of fit between two parts where interference exists, requiring pressure or heat to assemble, ensuring a tight and secure connection.
Transitional Fit
A type of fit in mechanical engineering where parts can either move together freely (clearance fit) or interfere slightly (interference fit), depending on the tolerances.
Maximum Interference
The largest value by which one part exceeds the size of its mating part, making assembly possible only with the application of force.
Q2: organs<br>A)a collection of similar cells that carry
Q11: A competitive inhibitor binds to<br>A) a region
Q18: basolateral membrane
Q43: In considering overall materiality for planning purposes,an
Q47: The Internet database for molecular,cellular,and physiological information
Q58: An engagement letter is used primarily to<br>A)
Q63: Which of the following client internal control
Q73: The activity of metabolic pathways is influenced
Q120: Atoms in a covalent molecule<br>A) share electrons
Q154: Describe the structure of the cytoskeleton,and list