Table 4-4
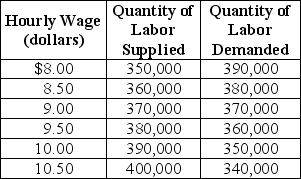 Table 4-4 shows the demand and supply schedules for the low-skilled labor market in the city of Westover.
-Refer to Table 4-4.Suppose that the quantity of labor supplied increases by 40,000 at each wage level.What are the new free market equilibrium hourly wage and the new equilibrium quantity of labor?
Definitions:
Q9: According to a recent study,"Stricter college alcohol
Q21: Some economists have argued that certain characteristics
Q46: Refer to Figure 4-1.What is the total
Q68: Of the types of business organizations in
Q89: Refer to Table 2-8.Which of the following
Q95: If the quantity of hearing aids demanded
Q137: In the 1973 movie Save the Tiger,Jack
Q199: _ behavioral assumption about humans was that
Q200: If you purchased a newly issued 30-year
Q210: Refer to Table 2-7.Which of the following