Figure 11-1 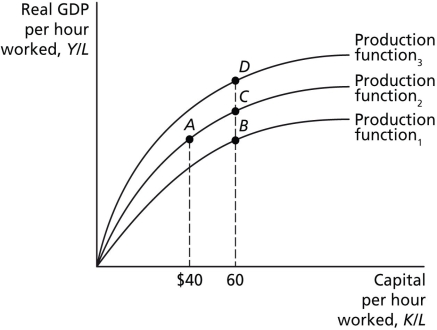
-Refer to Figure 11-1.Suppose the per-worker production function in the figure above represents the production function for the U.S.economy.If the United States decided to double its support of university research,this would cause a movement from
Definitions:
Q6: Since the 1950s<br>A)the United States has not
Q68: A small economy increased its capital per
Q77: At macroeconomic equilibrium<br>A)total investment equals total inventories.<br>B)total
Q125: In the long run,_ differences in economic
Q149: All of the following are reasons why
Q163: Describe how a lender can lose during
Q172: Refer to Table 9-23.The table above lists
Q178: If the CPI falls from 142 to
Q198: When firms benefit from the results of
Q226: Recent rapid economic growth in India and