Table 15-8
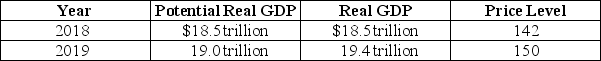
-Refer to Table 15-8.The hypothetical information in the table shows what the values for real GDP and the price level would have been in 2019 if the Federal Reserve did not use monetary policy:
a.If the Fed wanted to keep real GDP at its potential level in 2019,should it have used an expansionary policy or a contractionary policy? Should the trading desk have bought T-bills or sold them?
b.Suppose the Fed's policy was successful in keeping real GDP at its potential level in 2019.State whether each of the following would be higher or lower than if the Fed had taken no action:
(i)Real GDP
(ii)Full-employment real GDP
(iii)The inflation rate
(iv)The unemployment rate
c.Draw an aggregate demand and aggregate supply graph to illustrate your answer.Be sure that your graph contains LRAS curves for 2018 and 2019; SRAS curves 2018 and 2019; AD curve for 2018 and 2019,with and without monetary policy actions; and equilibrium real GDP and the price level in 2019 with and without policy.
Definitions:
Foreign Purchases
The buying of goods or services from another country, contributing to imports in the purchasing country's economy.
Current Account
A component of a country's balance of payments, reflecting the difference between its export and import of goods and services.
Account Surplus
A situation where the income or revenue in an account exceeds the expenditures or costs.
International Trade
The exchange of goods, services, and capital across international borders, driven by the concept of comparative advantage and differing resource endowments.
Q4: Lowering the discount rate will<br>A)decrease reserves,encourage banks
Q14: A cash withdrawal reduces deposits,reserves,and excess reserves
Q20: The total value of U.S.Treasury bonds outstanding
Q30: One factor which brought on the recession
Q91: The aggregate demand curve will shift to
Q124: A bank's liabilities are<br>A)things owned by or
Q141: The quantity theory of money implies that
Q160: A series of bank runs in a
Q270: To combat a recession with discretionary fiscal
Q273: Refer to Figure 16-1.Suppose the economy is