Multiple Choice
This graph shows the cost and revenue curves faced by a monopoly. 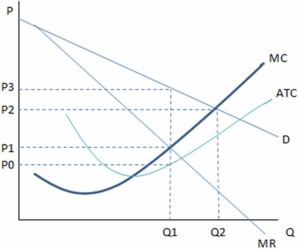
According to the graph shown,the profit being earned by this monopolist is:
Definitions:
Related Questions
Q19: Economists refer to the pattern of income
Q23: If you want to own $1 million
Q55: This graph demonstrates the domestic demand and
Q58: Someone is considered to have risk-seeking behavior
Q60: Total revenue is:<br>A)the amount that a firm
Q69: If a firm's demand curve in a
Q111: For a competitive firm,the marginal revenue product
Q128: This graph demonstrates the domestic demand and
Q151: If adopted by a firm,a labor-augmenting piece
Q153: For a competitive firm,the value of output