This graph depicts the demand for a normal good. 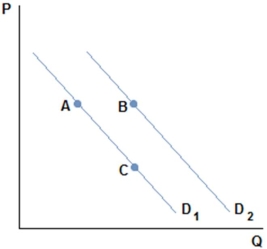
A movement from A to B in the graph shown might be caused by:
Definitions:
Substitute
A product or service that can be used in place of another to satisfy similar needs or desires.
Equilibrium
A state in which market supply and demand balance each other, resulting in stable prices and quantities.
Demand Decreases
A situation where the quantity of a product or service sought by buyers is less than it was previously, often leading to lower prices.
Supply Increases
Supply increases refer to a situation in which the availability of a product or service in the market rises, which can be due to factors such as improved production methods or increased raw material availability.
Q14: Both trans fats and saturated fats have
Q27: Using a process called photosynthesis,plants make energy-rich
Q33: Assume a market that has an equilibrium
Q41: The demand schedule assumes:<br>A)that factors other than
Q51: You are given an unknown substance and
Q52: The best example of a perfectly competitive
Q110: As corn prices rise,salsa sales tend to
Q119: The supply curve:<br>A)represents producers' willingness to sell.<br>B)shows
Q132: When graphing the demand curve:<br>A)quantity goes on
Q141: A table which shows the quantities of