Figure 3.8 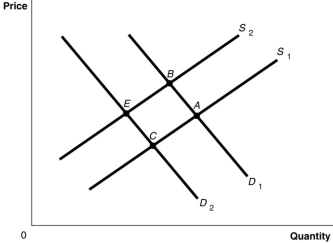
-Refer to Figure 3.8.The graph in this figure illustrates an initial competitive equilibrium in the market for sugar at the intersection of D1 and S2 (point B) . If there is a decrease in the price of fertilizer used on sugar cane and there is a decrease in tastes for sugar-sweetened soft drinks, how will the equilibrium point change?
Definitions:
Annually Compounded
Describes the process where interest is added to the principal sum of a loan or investment once per year, allowing the interest to accumulate over time.
Promotion
Marketing strategies aimed at increasing the visibility, sales or acceptance of a product or service.
Monthly Compounded
The process of calculating interest each month and adding it to the total amount owed, thus earning interest on interest from the following month.
Semi-Annually Compounded
Describes the methodology of applying interest to a principal amount two times within a year.
Q83: a.Draw a production possibility frontier for a
Q134: The graph below represents the market for
Q143: Consider the following pairs of items: <br>a.shampoo
Q146: Damian shares a small food truck with
Q160: The following equations represent the demand and
Q169: Refer to Figure 5.7.For each unit sold,
Q176: If, when price changes by 35 per
Q189: If an increase in income leads to
Q215: If the percentage increase in price is
Q224: Seth is a competitive body builder.He says