Figure 3-8 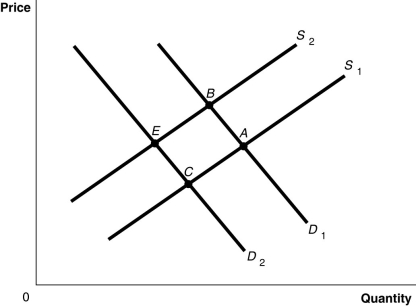
-Refer to Figure 3-8. The graph in this figure illustrates an initial competitive equilibrium in the market for apples at the intersection of D1 and S1 (point A) . If the price of oranges, a substitute for apples, decreases and the wages of apple workers increase, how will the equilibrium point change?
Definitions:
Q6: If the market price is at equilibrium,
Q41: Refer to Table 2.8.Scotland has a comparative
Q86: Suppose that when the price per ream
Q112: Stricter laws and regulations to protect intellectual
Q115: A tax is efficient if it imposes
Q128: The income effect of a price change
Q130: Assume that the hourly price for the
Q166: Most people would prefer to drive a
Q195: If the price elasticity of demand is
Q209: Assume that you own a small boutique