Figure 3-8 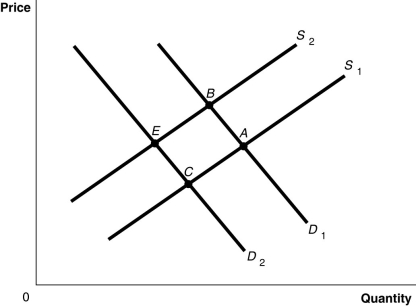
-Refer to Figure 3-8. The graph in this figure illustrates an initial competitive equilibrium in the market for sugar at the intersection of D1 and S1 (point A) . If there is an increase in the price of fertilizer used on sugar cane and there is a decrease in tastes for sugar-sweetened soft drinks, how will the equilibrium point change?
Definitions:
Clear Contents
The action of removing or deleting the information within a selected area, leaving the area empty but intact.
Auto Outline
A feature in spreadsheet software like Microsoft Excel that automatically creates an outline of your data based on formulas, grouping data together for easy analysis and summary.
Group Worksheet Data
The process of summarizing or organizing similar data within different rows or columns in a spreadsheet for analysis.
Read-Only File
A file with permissions set to allow viewing or reading but not modifying or editing by the user.
Q14: If the price of chewing gum is
Q29: When you purchase a new set of
Q31: Suppose when the price of laptops falls,
Q31: In the economic sense, almost everything is
Q35: Adam Smith's behavioural assumption about humans was
Q61: Consider the following economic agents: <br>a.the government<br>b.
Q76: Let D = demand, S = supply,
Q78: Most food products have low income and
Q121: In a free market there are virtually
Q200: The demand for all carbonated beverages is