Table 7.4 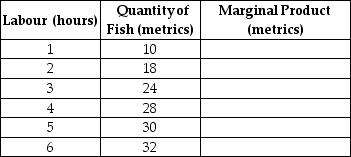
-Refer to Table 7.4.The table above shows the following relationship between hours spent fishing and the quantity of fish caught for Juan, a commercial fisherman.
a.Complete the Marginal Product column in Table 7-4.
b.Characterise the production function, i.e.does the production function display increasing marginal returns, diminishing marginal returns, etc.
c.Using the data above, graph Juan's marginal product curve.Be sure to label the horizontal and vertical axes.Is your graph consistent with your answer to part (b)? Explain.
d.Juan uses the following inputs for fishing - a small wooden boat (B), a fishing pole (P)and of course, his labour (L).Treating the boat and the fishing pole as fixed inputs and using the data above, graph Juan's Total Product of labour curve.Be sure to label the horizontal and vertical axes.
e.(Extra Credit)The opportunity cost of Juan's time is $8 per hour.If Juan receives $2 per metric for his fish, what is the optimal number of hours he should spend fishing? Explain how you arrived at your answer.Hint: Recall marginal benefit and marginal cost analysis.
__________________________________________________________________________________________________________________________________________________________________________________________
Definitions:
Q6: You wish to buy only one CD.Use
Q27: What is the additional utility that George
Q54: The payroll tax is a tax imposed
Q107: A common mistake made by consumers is
Q149: Which of the following statements about utility
Q155: Most pharmaceutical firms selling prescription drugs continue
Q170: What is the difference between explicit costs
Q216: The price a perfectly competitive firm receives
Q221: The endowment effect is<br>A)the phenomenon that economic
Q270: Long-run cost curves are U-shaped because<br>A)of the