Suppose Argyle Sachs has to choose between building a smaller sweater factory and a larger sweater factory.In the following graph, the relationship between costs and output for the smaller factory is represented by the curve ATC1, and the relationship between costs and output for the larger factory is represented by the curve ATC2. 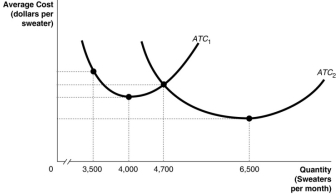 a.If Argyle expects to produce 3600 sweaters per month, should he build a smaller factory or a larger factory? Briefly explain.
b.If Argyle expects to produce 5000 sweaters per month, should he build a smaller factory or a larger factory? Briefly explain.
c.If the average cost of producing sweaters is lower in the larger factory when Argyle produces 6500 sweaters per week, why isn't it also lower when Argyle produces 4000 sweaters per week?
__________________________________________________________________________________________________________________________________________________________________________________________
Definitions:
Subform
A form embedded within another form in a database application, often used to show related records.
Option Group
A user interface control that presents a set of mutually exclusive choices to the user, often represented as radio buttons or a dropdown list.
Command Button
A control element in graphical user interfaces that executes a specific command or action when clicked by the user.
Linked Data
A set of best practices for connecting structured data across the web, enabling data from different sources to be connected and queried.
Q37: Refer to Figure 9.11.If the firm maximises
Q76: Marginal revenue is<br>A)total revenue divided by the
Q96: A U-shaped long run average cost curve
Q106: Which of the following describes a situation
Q147: A constant cost, perfectly competitive market is
Q167: Which of the following refers to the
Q221: Refer to Figure 9.11.Assume the firm maximises
Q225: Refer to Table 6.4.For steak and cheese
Q265: Assume that price is greater than average
Q290: In economics, what is the difference between