Multiple Choice
Figure 8.5 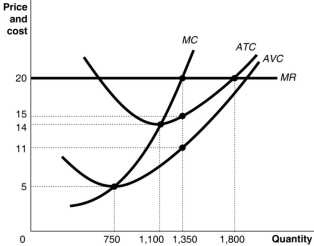 Figure 8.5 shows cost and demand curves facing a typical firm in a constant-cost, perfectly competitive industry.
-Refer to Figure 8.5.If the market price is $20, the firm's profit-maximising output is
Definitions:
Related Questions
Q5: Refer to Figure 7.1.What is the marginal
Q45: Average total cost is equal to<br>A)average fixed
Q101: The division of labour and specialisation explain<br>A)why,
Q178: Which of the following is not an
Q180: Refer to Figure 8.2.What is the amount
Q182: If price is equal to average variable
Q186: With perfect price discrimination there is<br>A)no deadweight
Q187: The additional output a firm produces by
Q249: What is a sunk cost?<br>A)Another term that
Q297: Refer to Figure 7.15.The figure above illustrates