Figure 8.5 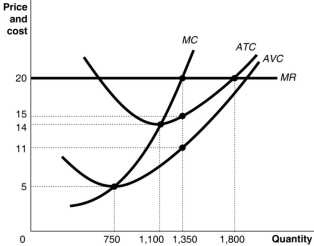 Figure 8.5 shows cost and demand curves facing a typical firm in a constant-cost, perfectly competitive industry.
-Refer to Figure 8.5.The figure shows the cost structure of a firm in a perfectly competitive market.If the firm's fixed cost increases by $1000 due to a new environmental regulation, what happens to its profit-maximising output level?
Definitions:
Q3: Explain the differences between total revenue, average
Q8: What is meant by allocative efficiency? How
Q29: Refer to Figure 6.7.If the consumer has
Q34: What does the law of diminishing marginal
Q46: Whenever a firm can charge a price
Q142: A natural monopoly is characterised by large
Q170: Both individual buyers and sellers in perfect
Q187: If a monopolist's marginal revenue is $35
Q237: Why are individual buyers and sellers in
Q245: The profit-maximising rule for a monopolistically competitive