Figure 16.2 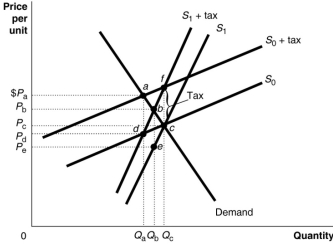 Figure 16.2 shows a demand curve and two sets of supply curves, one set more elastic than the other.
-Refer to Figure 16.2.If the government imposes an excise tax of $1.00 on every unit sold, the government's revenue from the tax is represented by the area
Definitions:
Social Desirability Effect
The tendency of survey respondents to answer questions in a manner that will be viewed favorably by others, often leading to overreporting of "good" behavior or underreporting of "bad" behavior.
Survey Respondents
Individuals who answer or provide data in response to questions posed in a survey, which can be used for research or polling purposes.
Margin Of Error
The amount of inaccuracy allowed in the results of a survey or poll, often expressed as a percentage.
Public Opinion Survey
A method used to measure the opinions or attitudes of a population regarding specific issues or policies.
Q12: All of the following evidence-gathering procedures can
Q12: Refer to Figure 14.2.The optimal quantity of
Q26: In violation of company policy, Morley Ltd
Q39: After obtaining an understanding of an entity's
Q43: An auditor reviews the credit ratings of
Q43: Which of the following displays these two
Q70: According to the benefits-received principle of taxation,<br>A)individuals
Q89: If a doctor knows that an insurance
Q95: For a given supply curve, how does
Q181: An external benefit is created when you