Figure 16.3 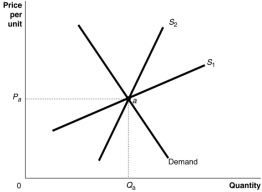
-Refer to Figure 16.3.The figure above shows a demand curve and two supply curves, one more elastic than the other.Use Figure 16-3 to answer the following questions.
a.Suppose the government imposes an excise tax of $1.00 on every unit sold.Use the graph to illustrate the impact of this tax.
b.If the government imposes an excise tax of $1.00 on every unit sold, will the consumer pay more of the tax if the supply curve is S1 or S2? Refer to the graphs in your answer.
c.If an excise tax of $1.00 on every unit sold is imposed, will the revenue collected by the government be greater if the supply curve is S1 or S2?
d.If the government imposes an excise tax of $1.00 on every unit sold, will the deadweight loss be greater if the supply curve is S1 or S2?
Definitions:
Information Flow
The movement and exchange of information within and between organizations, systems, or processes.
Inventory System
An organized method for managing and controlling the ordering, storage, and use of components that a company will use in the production of the items it will sell as well as the management of the finished products that are for sale.
Understocking
The condition of having insufficient inventory to meet demand, leading to potential lost sales and customer dissatisfaction.
Integrated Supply Chain
A holistic approach to supply chain management that emphasizes the coordination and synchronization of all elements of the supply chain, from raw materials to end customer.
Q11: China has developed a comparative advantage in
Q14: Which of the following is the best
Q16: Which of the following tends to be
Q21: A flowchart is most frequently used by
Q24: Which of the following procedures would not
Q25: Refer to Figure 16.1.Of the tax revenue
Q69: Refer to Figure 15.1.If, because of an
Q110: The social cost of a good or
Q117: Distinguish between a voluntary export restraint and
Q152: What is a private good?<br>A)A good that