Multiple Choice
Exhibit 21-7 Use the cost-volume-profit graph below to answer the following question(s) .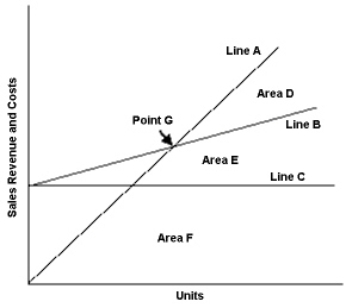
-Refer to Exhibit 21-7. Area E on the cost-volume-profit graph represents the:
Definitions:
Related Questions
Q17: Design cycle time is an example of
Q18: Refer to Exhibit 21-5. What will
Q20: When determining the amount of cash payments
Q45: An example of an operations process measure
Q52: Cochise Company manufacturers top of the line
Q68: Bondy Corporation makes widgets. The following are
Q69: Costs incurred to handle customer complaints are:<br>A)
Q71: An example of an outcome performance measure
Q86: Exhibit 22-3 Shasta Company is operating at
Q104: Revenues cause<br>A) An increase in net assets<br>B)