Multiple Choice
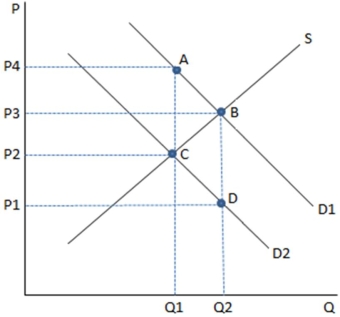 This graph depicts a tax being imposed,causing demand to shift from D1 to D2.The amount of tax revenue being generated by the tax imposed in the graph shown is:
Definitions:
Related Questions
Q17: An example of a good that is
Q18: One way to make consumers take a
Q28: When a Pigouvian subsidy is imposed on
Q57: Compared to proportional-representation systems,two-party systems are thought
Q61: The government can both set the efficient
Q71: The most common form of "forced savings"
Q77: In general,the most efficient taxes:<br>A) are often
Q84: Temporary Assistance to Needy Families is a
Q109: A standard way to measure income mobility
Q140: A country may gain a temporary comparative