This graph demonstrates the domestic demand and supply for a good,as well as a quota and the world price for that good. 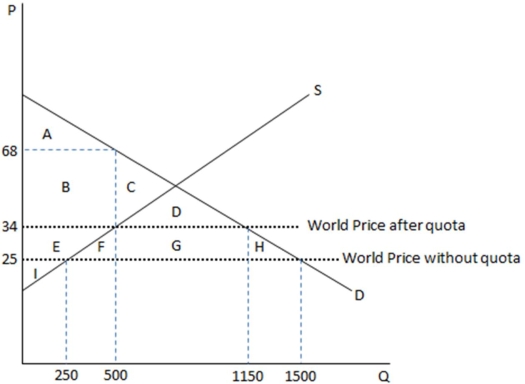 According to the graph shown,if the government restricts free trade,area G represents:
Definitions:
ASPE
Accounting Standards for Private Enterprises; a set of accounting standards for privately held companies in Canada.
IFRS
IFRS, or International Financial Reporting Standards, are a set of accounting standards developed by the IASB that aim to ensure transparency, accountability, and efficiency in the financial statements of public companies globally.
Liabilities Reporting
The process of disclosing a company's obligations and debts on its financial statements.
Revenues Test
A criterion used to assess whether revenues are being recognized in the correct accounting period under the accrual basis of accounting.
Q24: In order to minimize deadweight loss generated
Q30: A tax meant to counter the effect
Q37: The administrative burden of a tax is:<br>A)
Q88: The third largest source of government tax
Q95: When a perfectly competitive firm increases output,total
Q103: This prisoner's dilemma game shows the payoffs
Q109: In a market where the tragedy of
Q118: This graph demonstrates the domestic demand and
Q133: In the real world:<br>A) businesses can easily
Q167: Eli can decide between two jobs.One job