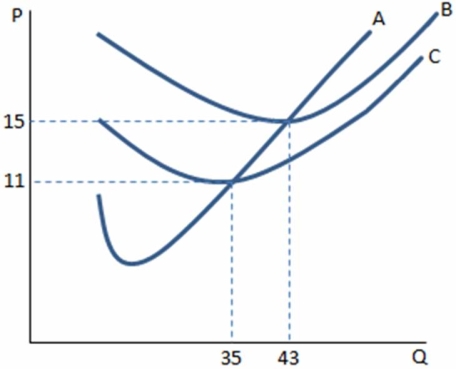
 Of the curves displayed in the graph shown,graph B is most like to be the:
Definitions:
Production Function
A mathematical model describing the relationship between the inputs used in production and the output of goods or services produced.
Long-Run Marginal Cost Curve
A graphical representation showing the change in total cost associated with producing one more unit of output when all inputs are variable.
Price of Labor
The compensation, including wages, salaries, and benefits, that employers pay to employees for their labor or work done.
Long-Run Cost Function
A representation of the total cost associated with production when all factors of production are variable.
Q7: A consequence of a publicly owned natural
Q7: Suppose Winston's annual salary as an accountant
Q19: An essential characteristic of a perfectly competitive
Q67: Building a good reputation in the marketplace:<br>A)
Q71: Present value is:<br>A) how much a certain
Q79: An approach that can be taken by
Q95: A market that consists of only a
Q99: A characteristic that is important,but not essential
Q113: Suppose Larry's Lariats produced 25,000 lassos and
Q135: The government can help solve the information