This graph shows three different budget constraints: A,B,and C. 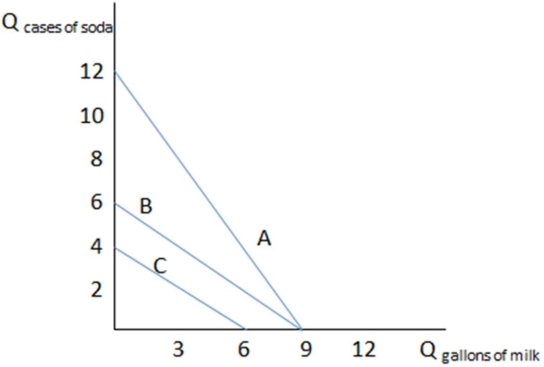 If Bert has budget constraint A in the graph shown,what is his opportunity cost of three gallons of milk?
Definitions:
Theory of Planned Behavior
A psychological theory that predicts human behavior on the basis of attitudes, subjective norms, and perceived control over the behavior.
Description
The act of providing details or characteristics of someone or something to give a clear picture.
Organization
pertains to a structured group of people with specific roles and duties working together to achieve common goals or objectives, often in a coordinated and systematic manner.
Direction
Guidance or supervision on how to perform tasks or the course along which something moves or is aimed to move.
Q11: One effect of government mandating participation in
Q13: Behavioral economists have found that people _,and
Q21: A buyer always wants to:<br>A) buy for
Q21: Claire bought a new TV,and the old
Q32: In making decisions about insurance,a crucial piece
Q54: Creating a market that was previously "missing":<br>A)
Q66: Assume there are three hardware stores,each willing
Q67: Building a good reputation in the marketplace:<br>A)
Q71: The best example of a standardized good
Q104: <img src="https://d2lvgg3v3hfg70.cloudfront.net/TB1248/.jpg" alt=" Assume Alan's budget