Figure 21.2 shows the benefit functions for low-ability workers and high-ability workers (A and B) ,along with one indifference curve for each worker type (C and D) .The employer cannot observe worker type directly but has created two positions,E and F,as a screening mechanism.Which of the following is true? 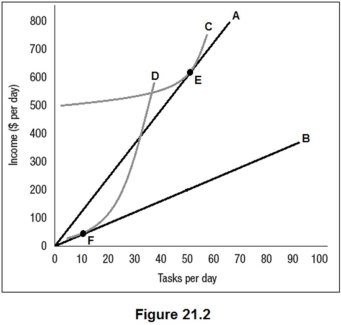
Definitions:
Economic Growth
An increase in the production of economic goods and services, compared from one period of time to another, typically measured by GDP.
Less Developed Countries
Countries with a lower level of material wealth, economic activity, and quality of life, often characterized by low GDP per capita and human development indices.
Production Predominates
A condition where the manufacturing or creation of goods is the dominant economic activity in a particular area or sector.
Savings Rate
The percentage of income that is not spent on consumption but instead is saved or invested for future use.
Q4: Suppose Always There Wireless serves 100 high-demand
Q9: Suppose Always There Wireless serves 100 high-demand
Q13: The indifference curves in Figure 21.1 slope
Q17: List the four basic functions of law.
Q23: A person who uses a rule of
Q24: Which of the following is an example
Q36: Kate's Great Crete (KGC)is a local monopolist
Q37: The market demand function for wheat is
Q38: Common property resources include:<br>A) movies.<br>B) fast food.<br>C)
Q39: Which of the following is a feature