Related Questions
Q3: The economic system of which of the
Q13: A decrease in the current minimum wage
Q31: Which of the following is not held
Q34: When a demand curve shifts,both the equilibrium
Q47: If the demand for milk is downward
Q122: Assuming that the demand and supply of
Q132: Exhibit 6-2 <img src="https://d2lvgg3v3hfg70.cloudfront.net/TB2081/.jpg" alt="Exhibit 6-2
Q159: To say that a price ceiling is
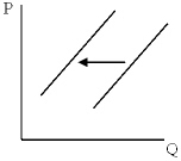
Q170: Exhibit 3-10 <img src="https://d2lvgg3v3hfg70.cloudfront.net/TB2081/.jpg" alt="Exhibit 3-10
Q223: Which of the following would cause a