Figure 2-19
In the following graph the x-axis shows the number of times a commuter rail train stops at a station per hour and the y-axis shows the number of commuter rail passengers per hour.
Commuter Rail Passengers by Frequency of Service 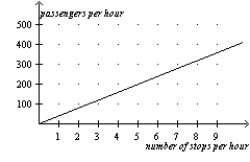
-Refer to Figure 2-19.A policymaker observes this graph and concludes that increasing the frequency of commuter rail service is a certain way to get more commuters to choose the commuter rail instead of driving their own cars.You warn the policymaker about making a reverse causality mistake with which of the following statements?
Definitions:
Purchase Discount
A reduction in the price paid for goods or services if payment is made within a specified time frame.
Early Payment
A financial transaction where a debt or obligation is settled before its due date.
Credit Period
The duration of time the buyer is given to pay for a purchase after the goods are delivered or the services are provided.
Discount Period
The time frame during which a buyer can pay less than the full invoice amount due to early payment incentives.
Q27: Give an example of a trade-off faced
Q50: In the circular-flow diagram, firms own the
Q67: Refer to Table 3-14. Assume that Nick
Q316: Refer to Figure 2-10, Panel (a) and
Q432: Refer to Figure 2-14. Which point(s) on
Q462: The opportunity cost of an item is<br>A)
Q469: Kelly and David are both capable of
Q543: The essence of science is<br>A) the laboratory
Q545: The slope of a line that passes
Q557: A macroeconomist, rather than a microeconomist, would