Figure 5-4 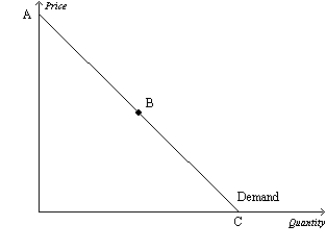
-Refer to Figure 5-4.Assume,for the good in question,two specific points on the demand curve are (Q = 1,000,P = $40) and (Q = 1,500,P = $30) .Then which of the following scenarios is possible?
Definitions:
Lerner Index
A measure of a firm's pricing power and market control, calculated as the difference between price and marginal cost, divided by price.
Elastic Demand
A situation where the quantity demanded of a good or service significantly changes in response to a change in its price.
Lerner Index
An economic measure of a firm's market power, calculated as the difference between price and marginal cost relative to price, indicating the degree of monopoly power.
Monopoly Power
The degree of power held by a monopoly, characterized by the ability to control market prices and exclude competitors within a particular market or industry.
Q46: On a certain supply curve, one point
Q100: If a binding price floor is imposed
Q244: Refer to Figure 5-15. Using the midpoint
Q282: If the price elasticity of demand for
Q308: Suppose an airline determines that its customers
Q327: Refer to Figure 5-5. At a price
Q381: Who gets scarce resources in a market
Q501: Refer to Figure 4-31. Suppose there is
Q530: If a firm is facing inelastic demand,
Q691: Refer to Table 4-14. If the four