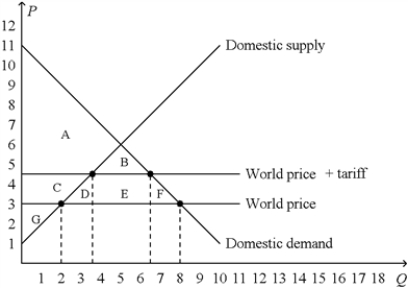
Figure 9-16.The figure below illustrates a tariff.On the graph,Q represents quantity and P represents price. 
-Refer to Figure 9-16.The tariff
Definitions:
Magnitude
The size, extent, or importance of something, often quantitative in nature.
Perfect Positive Relationship
A correlation in which one variable increases exactly as the other one increases, represented by a correlation coefficient of +1.
Correlation Coefficient
A numerical measure that quantifies the strength and direction of a relationship between two variables.
Variables
Elements or characteristics that can vary within or across subjects.
Q15: When the government imposes taxes on buyers
Q33: For any country, if the world price
Q49: Suppose the world price of a television
Q154: Which of the following statements is correct?<br>A)
Q242: Refer to Figure 9-7. With trade, the
Q322: Refer to Figure 9-17. With free trade,
Q330: Refer to Figure 9-25. Suppose the government
Q340: When Monique drives to work every morning,
Q404: Refer to Figure 9-29. Suppose the country
Q493: Most economists view the United States as