Figure 9-18.On the diagram below,Q represents the quantity of peaches and P represents the price of peaches.The domestic country is Isoland. 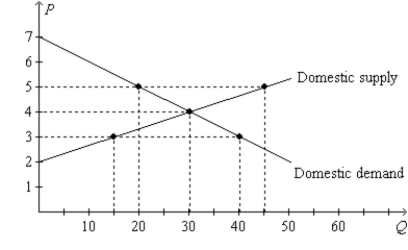
-Refer to Figure 9-18.Suppose Isoland changes from a no-trade policy to a policy that allows international trade.If the world price of peaches is $5,then the policy change results in a
Definitions:
Variable Cost
Variable cost is the cost that changes in direct proportion to the volume of output or activity in production, services, or other cost-incurred activities.
Fixed Costs
Expenses that do not change with the level of production or sales, such as rent, salaries, and insurance.
Variable Cost
Costs that change in proportion to the level of activity or volume of production in a business.
Contribution Margin
The amount by which the unit selling price exceeds the unit variable cost.
Q50: Suppose that flu shots create a positive
Q154: Which of the following ideas is the
Q188: After a country goes from disallowing trade
Q198: The Laffer curve is the curve showing
Q238: Economists feel that national security concerns never
Q264: Refer to Table 10-1. How large would
Q278: The Social Security tax is a labor
Q414: Spain is an importer of computer chips,
Q461: Which of the following arguments for trade
Q486: Assume, for England, that the domestic price