Multiple Choice
Figure 10-9 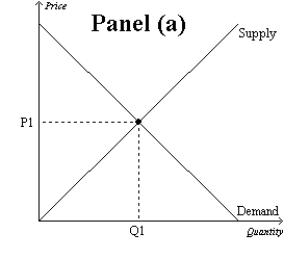
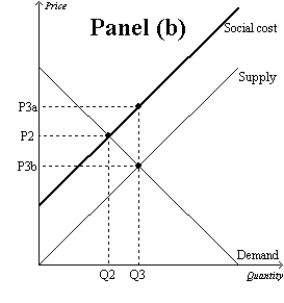
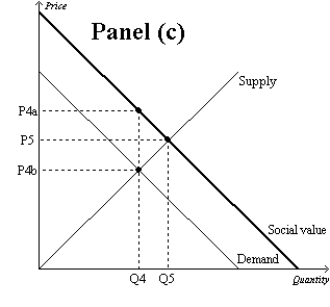
-Refer to Figure 10-9. Which graph represents a market with a negative externality?
Definitions:
Related Questions
Q97: Refer to Figure 9-13. With trade, producer
Q156: Refer to Scenario 10-1. Suppose the equilibrium
Q176: A free rider is a person who<br>A)
Q193: Refer to Figure 9-10. The area bounded
Q342: The idea that "externalities arise because something
Q354: For private goods allocated in markets,<br>A) prices
Q356: Which of the following is an example
Q384: An externality<br>A) results in an equilibrium that
Q455: Refer to Figure 9-22. Suppose the government
Q474: The world price of a ton of