Multiple Choice
Figure 10-9 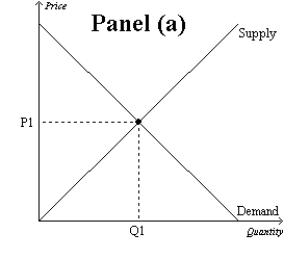
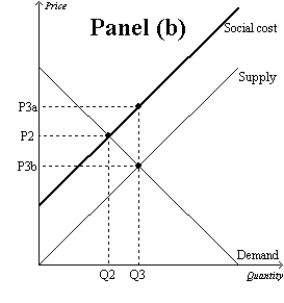
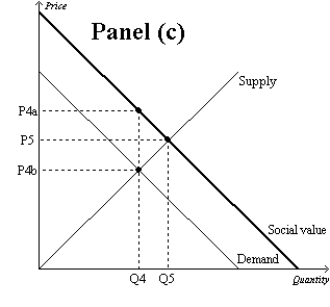
-Refer to Figure 10-9, Panel (b) and Panel (c) . The overuse of antibiotics leads to the development of antibiotic-resistant diseases. Therefore, the socially optimal quantity of antibiotics is represented by point
Definitions:
Related Questions
Q60: A cable television broadcast of a movie
Q74: At the local park there is a
Q125: Refer to Scenario 10-1. Let QMARKET represent
Q178: If a road is congested, then use
Q207: Refer to Figure 9-15. For the saddle
Q210: Refer to Table 10-1. What is the
Q317: Government intervention in the economy with the
Q391: Refer to Figure 9-27. With no trade
Q416: If we know that the demand curve
Q481: To economists, good environmental policy begins by