Figure 14-5
Suppose a firm operating in a competitive market has the following cost curves: 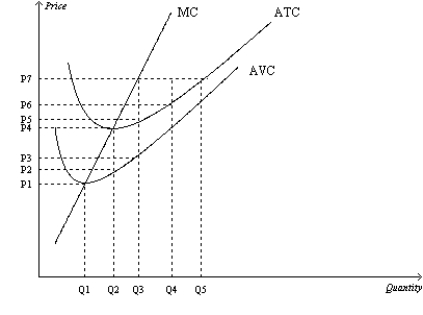
-Refer to Figure 14-5. When market price is P2, a profit-maximizing firm's losses can be represented by the area
Definitions:
Money Demand Curve
A graphical representation that shows the relationship between the quantity of money people want to hold and the interest rate.
Interest Rate
The sum, as a percentage of the principal, required by a lender from a borrower for the employment of assets.
Real GDP
Real GDP represents the total value of all goods and services produced over a specific time period, adjusted for inflation. It provides a more accurate measure of economic growth.
Price Level
A measure of the average of all prices in an economy, indicating the cost of goods and services at a specific time.
Q2: Which of the following firms is the
Q130: Refer to Scenario 15-2. PPCo will continue
Q131: In the long run the local coffee
Q186: Refer to Figure 14-1. If the market
Q214: Who is a price taker in a
Q232: Firms in a competitive market are said
Q256: When a firm is experiencing economies of
Q283: If a firm in a perfectly competitive
Q420: Suppose that some firms in a competitive
Q530: Refer to Table 14-3. For this firm,